StratGAN
Coupling a generative adversarial network with image quilting to produce basin-scale realizations of fluvial stratigraphy.
This was a project that began out of an interest to educate myself on machine learning topics, in association with a class I organized. The project goal was to explore subsurface uncertainty quantification through the use of GANs, and it is meant to be an exploratory analysis and thought experiment. I have decided to open source the project so that it is available as part of my professional portfolio.
This post contains some brief explanation of the model, but omits a lot of detail.
I hope to detail the model in a manuscript in the future.
The GitHub repository with the complete code can be found here!
Abstract
Subsurface reservoir size estimates involve considerable uncertainty, which impacts the quality of reserve size and valuation models. Conventional rules-based and process-based numerical models are useful to model this uncertainty, but involve simplifying assumptions about depositional environments and reservoir geology that may be poorly constrained. Generative adversarial neural networks (GANs) are a machine learning model that is optimized to produce synthetic data that are indistinguishable from an arbitrary training dataset, and are an attractive tool for modeling subsurface reservoirs. We have developed a generative adversarial network that is trained on laboratory experimental stratigraphy and produces realizations of basin-scale reservoir geology, while honoring ground-truth well log data. In this way, StratGAN reduces subsurface uncertainty through a large sampling of realistic potential rock geometries throughout a reservoir, without any a priori assumptions about the geology. StratGAN couples a deep-convolutional generative adversarial network (DCGAN) with an image quilting algorithm to scale up channel-scale realizations of reservoir geometries to basin-scale realizations.
Model description
The model is a deep-convolutional generative adversarial network (DCGAN) that has been trained on laboratory experiment data. I use custom tensorflow implementations of convolutional layers and dense layers, which include my flexible batch normalization operation. The GAN is trained on patches cropped out of slices from the Tulane Delta Basin 10-1 experiment. Each of 6 slices was treated as separate categorical labels and fed into the GAN as a one-hot label vector.
Demonstration of workflow
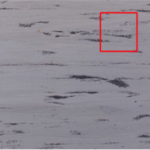
Patches from the GAN are at approximately the channel scale, where black pixels represent channel, and white is non-channel.
![]()
I have implemented Efros-Freeman minimum-cost-boundary image quilting, which stiches together the patches from the GAN (channel scale) to make a single realization at the basin scale. The patches fed to the E-F algorithm are optimized via conditional inpainting methods (e.g., Dupont et al., 2018) to match along the quilting overlap, as well as at any ground-truth data (e.g., cores).
Together, this method optimizes for the best patch possible, then identifies the best path for cut-and-pasting in the image quilting stage.
I have produced routines to include ground-truth data in the basin scale realizations, such as vertical core-logs that record channel and non-channel intervals.
We can produce an ensemble of ~100 realizations from the model, and average the samples to produce a static image, quantifying the expected probability of reservoir presence at any location.
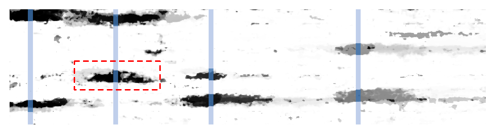
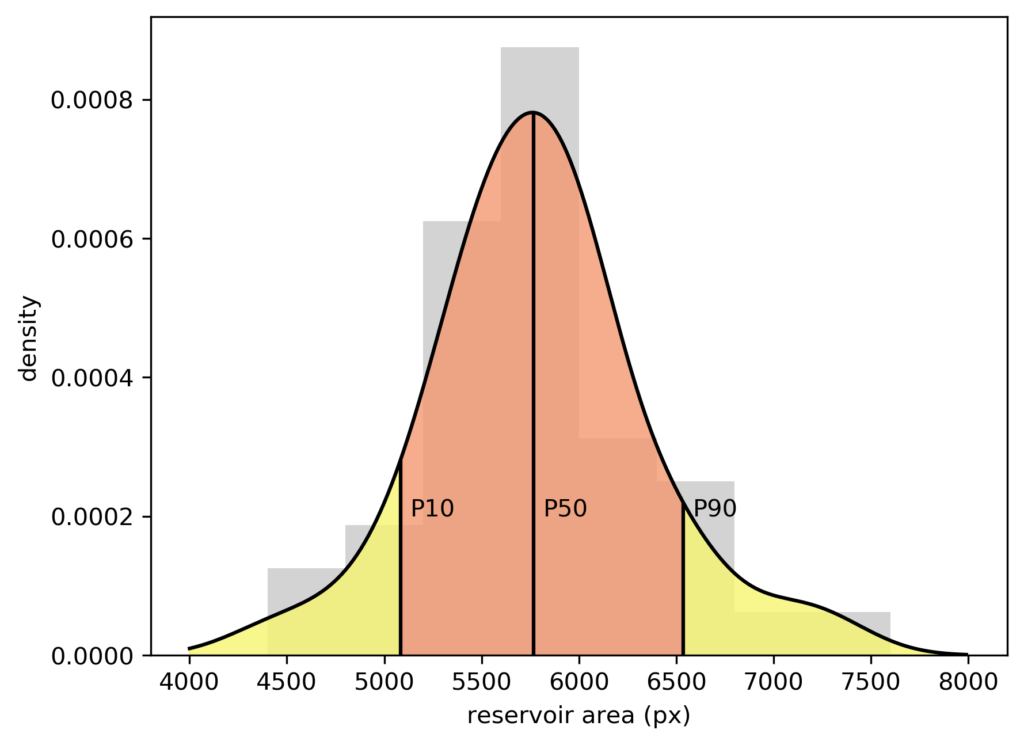
Going one step further, we can query the size of the reservoir connected to a specific channel interval in a core log (red dashed line in Figure 4).
This analysis gives a low-side-high-side estimate of reservoir size.
The model is a proof-of-concept for using GANs in subsurface uncertainty quantification.