
Isotope fractionation and sugar fermentation
For my first post on this blog, I wanted to share an old project I did during my undergraduate at Lehigh University. The credit for the idea and design of this project go out to Dr. Steve Peters and my TA in the course, Eric Ellison. The experiment was to track how the carbon isotopic concentration evolved by yeast fermenting sugars changed through time.
Let me back up a minute here and explain (very briefly) about isotope fractionation. Many Earth processes (in this case a biotic one) impart what is called a fractionation on the concentration of isotopes for a single element during and after the process. This largely happens because a particular elemental isotope is easier for the process to use or uptake, and so the other isotope(s) of the element become enriched in concentration.
An easy example to think about is oxygen isotope fractionation at the ocean-air interface. When the energy required for evaporation is being neared, water molecules that have a lighter oxygen isotope molecule will preferentially evaporate because they weigh less, and thus require less energy to switch into the gaseous phase. We measure isotopic concentrations as δ (that’s a delta) values, where a negative delta value means that the substance you are measuring is depleted in the isotope you are measuring for against some standard reference value that is globally recognized and used. Scientists do this so we can all talk to each other about isotopic concentrations and understand what the implications actually are, rather than just hearing some concentration!
So, the experiment we conducted looked at the isotopic concentration of carbon in carbon dioxide evolved from three solutions of simply sugar, water, and yeast. The variable that was changed in each solution was the sugar. One solution was comprised entirely of glucose sugar, one entirely of maltose sugar, and one had an equal weight mix of glucose and maltose. Now all we need to know going into this is that sugars are broken down by yeast and carbon dioxide is evolved as a byproduct; we measure the δ13C of that carbon dioxide. Below are the results from the study.
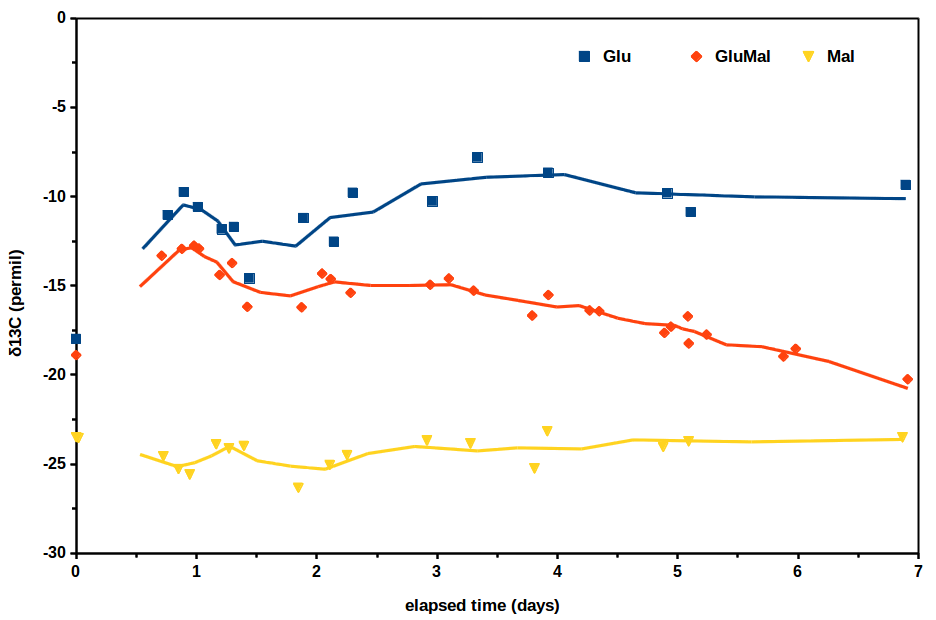
So how do we interpret this? Well, the simplest observations are usually the right ones! The glucose only solution generated a roughly constant δ13C of -10‰, the maltose only solution was also pretty constant at -25‰ δ13C, but the mixed solution did something interesting. At the beginning of the trials, it generated at a higher δ13C than it did by the end of the 7 day run. More specifically, it began close to -10‰ δ13C, but ended much closer to -25‰ δ13C; through time there is a shift from generating carbon dioxide sourced from glucose to sourced from maltose.
Pretty interesting! Well, I didn’t mention this before because I didn’t want to ruin the surprise, but this interpretation is backed up by the chemical structure of glucose and maltose. Glucose is a simple ring-shaped sugar, and maltose is, well, two glucose molecules joined by an oxygen. It therefore makes perfect sense that in a solution with both glucose and maltose, a yeast will preferentially break down the glucose first, since it is a simpler molecule and easier.
I’ve made some pretty big simplifications so that this post was able to remain reasonably short, so if you have a problem with an explanation or something else drop me a comment below or shoot me an email if you want to discuss more.