Groundwater flow demonstration slides
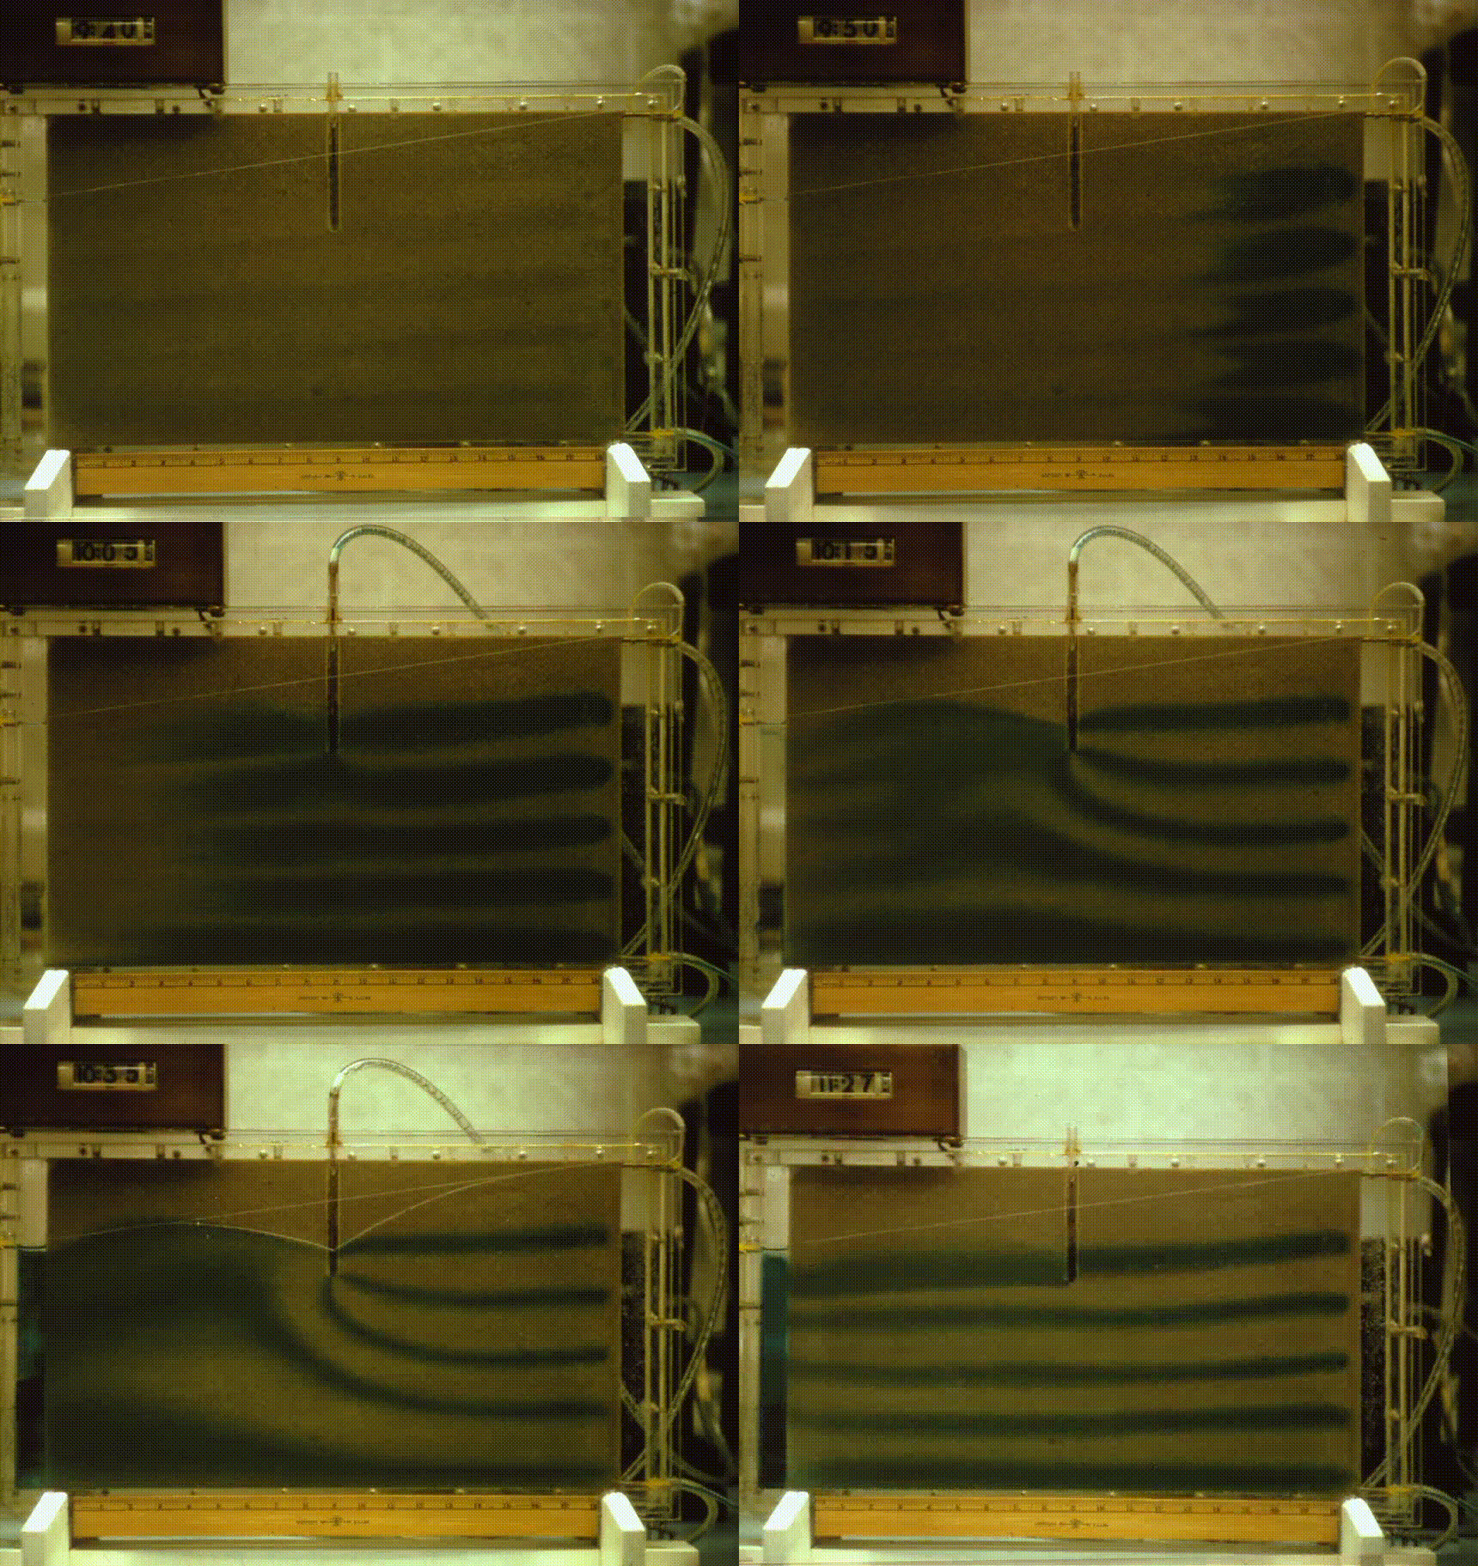
I recently came across a set of old slides from the National Water Well Association, created in 1977. The slides can be found here as an imgur album. These images show principles of groundwater flow that were not novel at the time, but the images do a great job of showing (through time series primarily) how different mediums can drastically change groundwater flow. Further, the slides show the effects of groundwater extraction through natural (gaining streams) and anthropogenic (wells). Below is a gif of the first ~20 slides I put together, which shows the experimenters setup over the duration of the experiment. There is a constant “head”, or a presence of water, at the right side that is flowing towards the left side of the experimental setup, with some dye being injected at a few depths to show the flow lines.

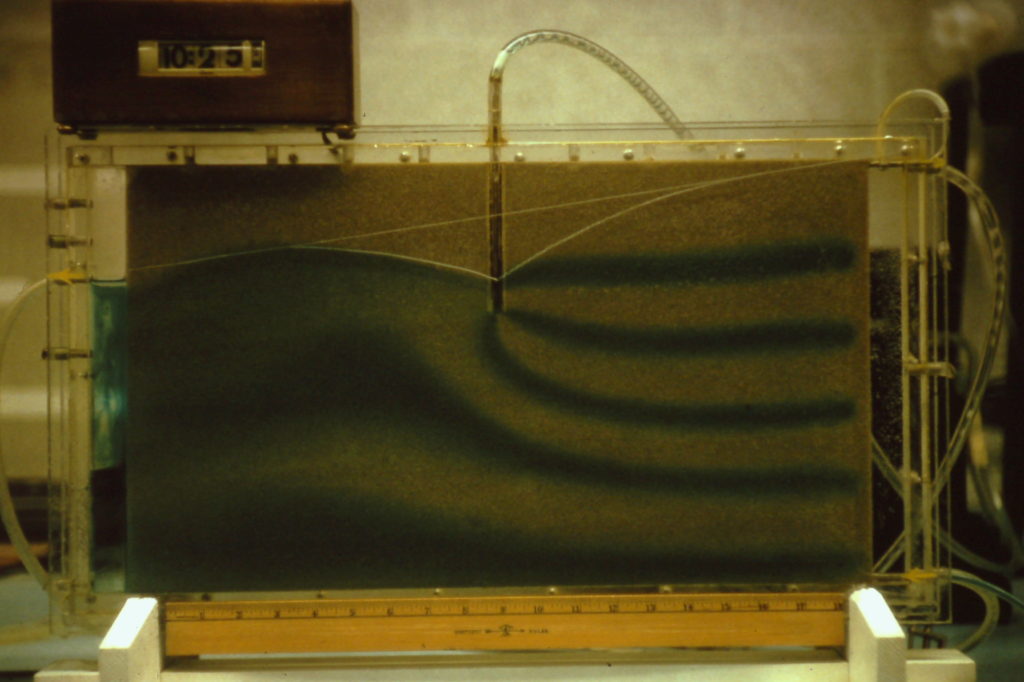
I’ve included my favorite image from the set below, which shows (beautifully) a cone of depression. When initially drilling a well, it (obviously) is critical to put the well into the water table, such that the pumping end of the well is entirely submerged. Once the well is “switched on”, there is a drawdown of the water table above the well pump head.

The cone forms around the well extraction point with its deepest point at the well head, as the well pulls water in from ALL directions (below included!). This disturbs the flow lines, which is shown really well by this experiment. Note that this experiment just shows a 2D slice of the cone, when in reality the “aquifer” is 3D and would extend into and out of your computer screen, making the wedge you see here a cone in three dimensions.
