
Yellow River shoreline traces
For some ongoing research I needed a set of shoreline traces of the Yellow River delta that I could measure some properties of to compare modeling results to. My model predicts delta lobe growth rates, for example the growth of the Qingshuigou lobe on the eastern side of the delta from 1976 to 1996.
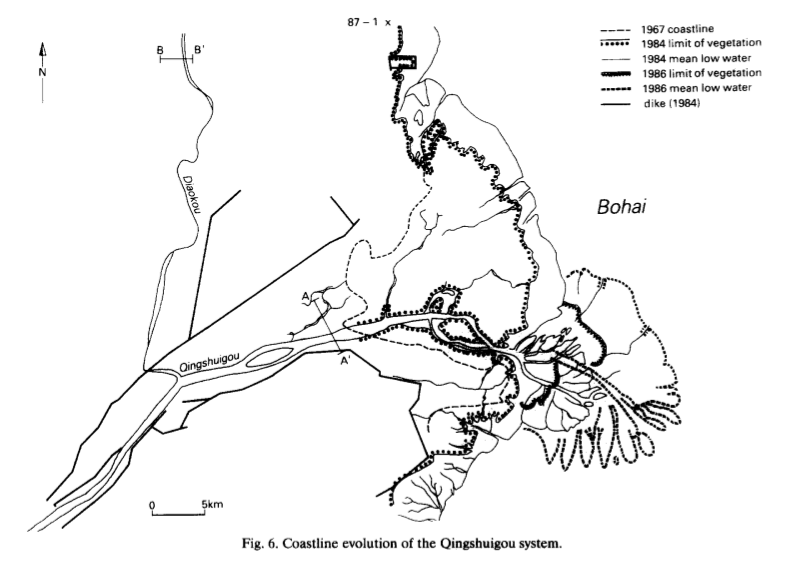
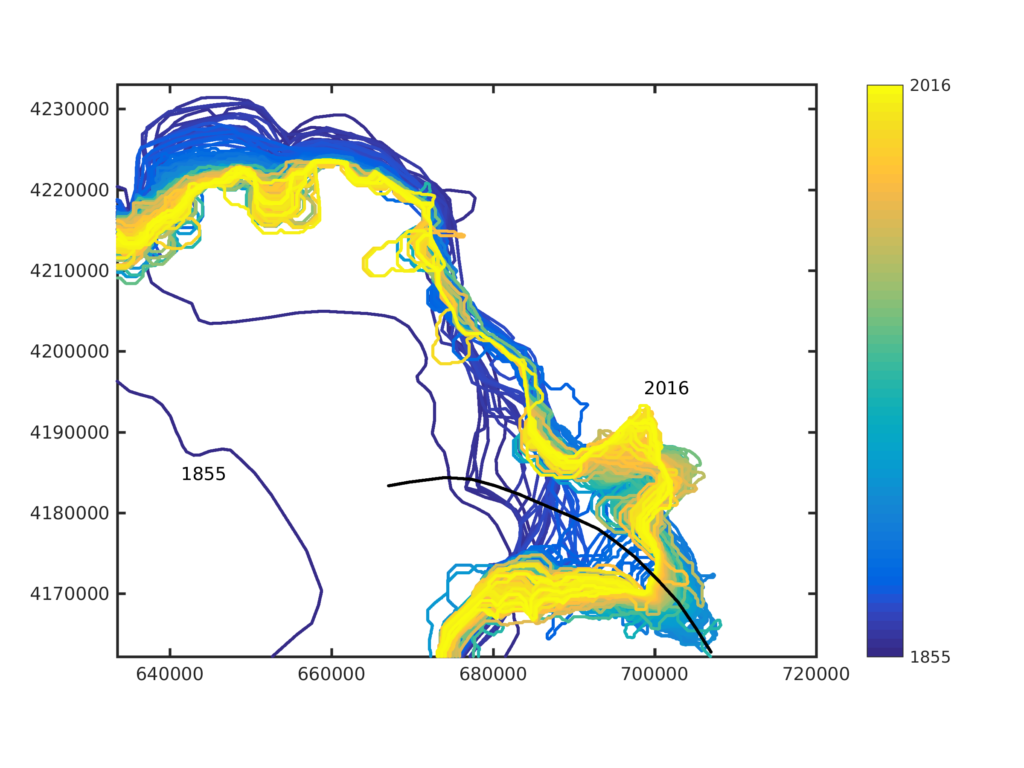
It’s a little early for me to release the data I’ve collected from the shoreline traces (n=296), or the code I used to generate the traces—but below is a figure mapping all the shoreline traces I have from 1855 to present. My model can also predict rates of delta system growth (i.e., growth over many lobe cycles) and I have generated data from these traces that I can compare to as well. I like the below figure, because I think it nicely demonstrates the rapid reworking of delta lobes (yes even on “river dominated” deltas!); evidenced most clearly by the retreat of the Diakou lobe to the north side of the delta.
This material is based upon work supported by the National Science Foundation Graduate Research Fellowship under Grant No. 1450681. Any opinion, findings, and conclusions or recommendations expressed in this material are those of the authors(s) and do not necessarily reflect the views of the National Science Foundation.