
Markov Chain stratigraphic model
I recently returned from the NCED2 Summer Institute for Earth Surface Dynamics at Saint Anthony Falls Laboratory at University of Minnesota, which is a 10-day long, intense workshop for early-career scientists to talk about novel methods and ideas in our field. This was the ninth, and hopefully not last, year of the meeting.
Typically the participants will do some sort of physical experiment (kind-of what the lab is known for being the best in the world for), but this year’s theme was about mathematics in Earth surface processes. We covered a range of subjects, but a lot of discussion came back to random walks, diffusion-like processes/simulations, and probability. Kelly Sanks and I worked on a project together, which combined a lot of these ideas.
Our question was: is deltaic sedimentation, and the resulting stratigraphy random? Specifically, we hypothesized that a pure “random walk” model can not capture the effect of the “stratigraphic filter”. However, a biased random walk model, where \(\Delta z\) depends on the previous time’s \(\Delta z\), can capture the dynamics of the system sufficiently to look like an actual stratigraphic sequence. The null hypothesis then is that both random walk models are indistinguishable from a stratigraphic succession.
To attack the problem, we decided to use a simple biased random walk model: Markov chains. These models have no physics incorporated, only probability, which made the project simple and easy to complete over beers at night. The Markov chain can be summarized as a sequence of “states” where the next state is chosen at random based on some probability to change to another given state or stay at the same state. Repeating this over and over gives a chain/sequence of states. In our simulation, the “states” were changes in elevation. Said another way, the next timestep’s change in elevation is dependent on the current timestep’s change in elevation. This hypothesis is grounded in the physics of river-deltas, whereby channel location (and thus locus of deposition/erosion elevation change) does not change immediately and at random, but rather is somewhat gradual.
When a system has more than a few states it becomes complicated to keep track of the probabilities, so we naturally use a matrix to define the probabilities. The so called “transition matrix” records the probability that given a current state (rows), the next state will be any given state (columns).
We used the Tulane Delta Basin experiment 12-1 which has a constant \(Q_w / Q_s\) ratio and RSLR rate for our data. This is kind of necessary for our question because we needed to know what the elevation was at some regular interval, and what the resulting stratigraphy after deposition and erosion was. The experimental delta surface was measured to mm accuracy every hour for 900 hours. We calculated \(\Delta z\) values over the entire experiment spatiotemporal domain, to inform our main biased random walk model.
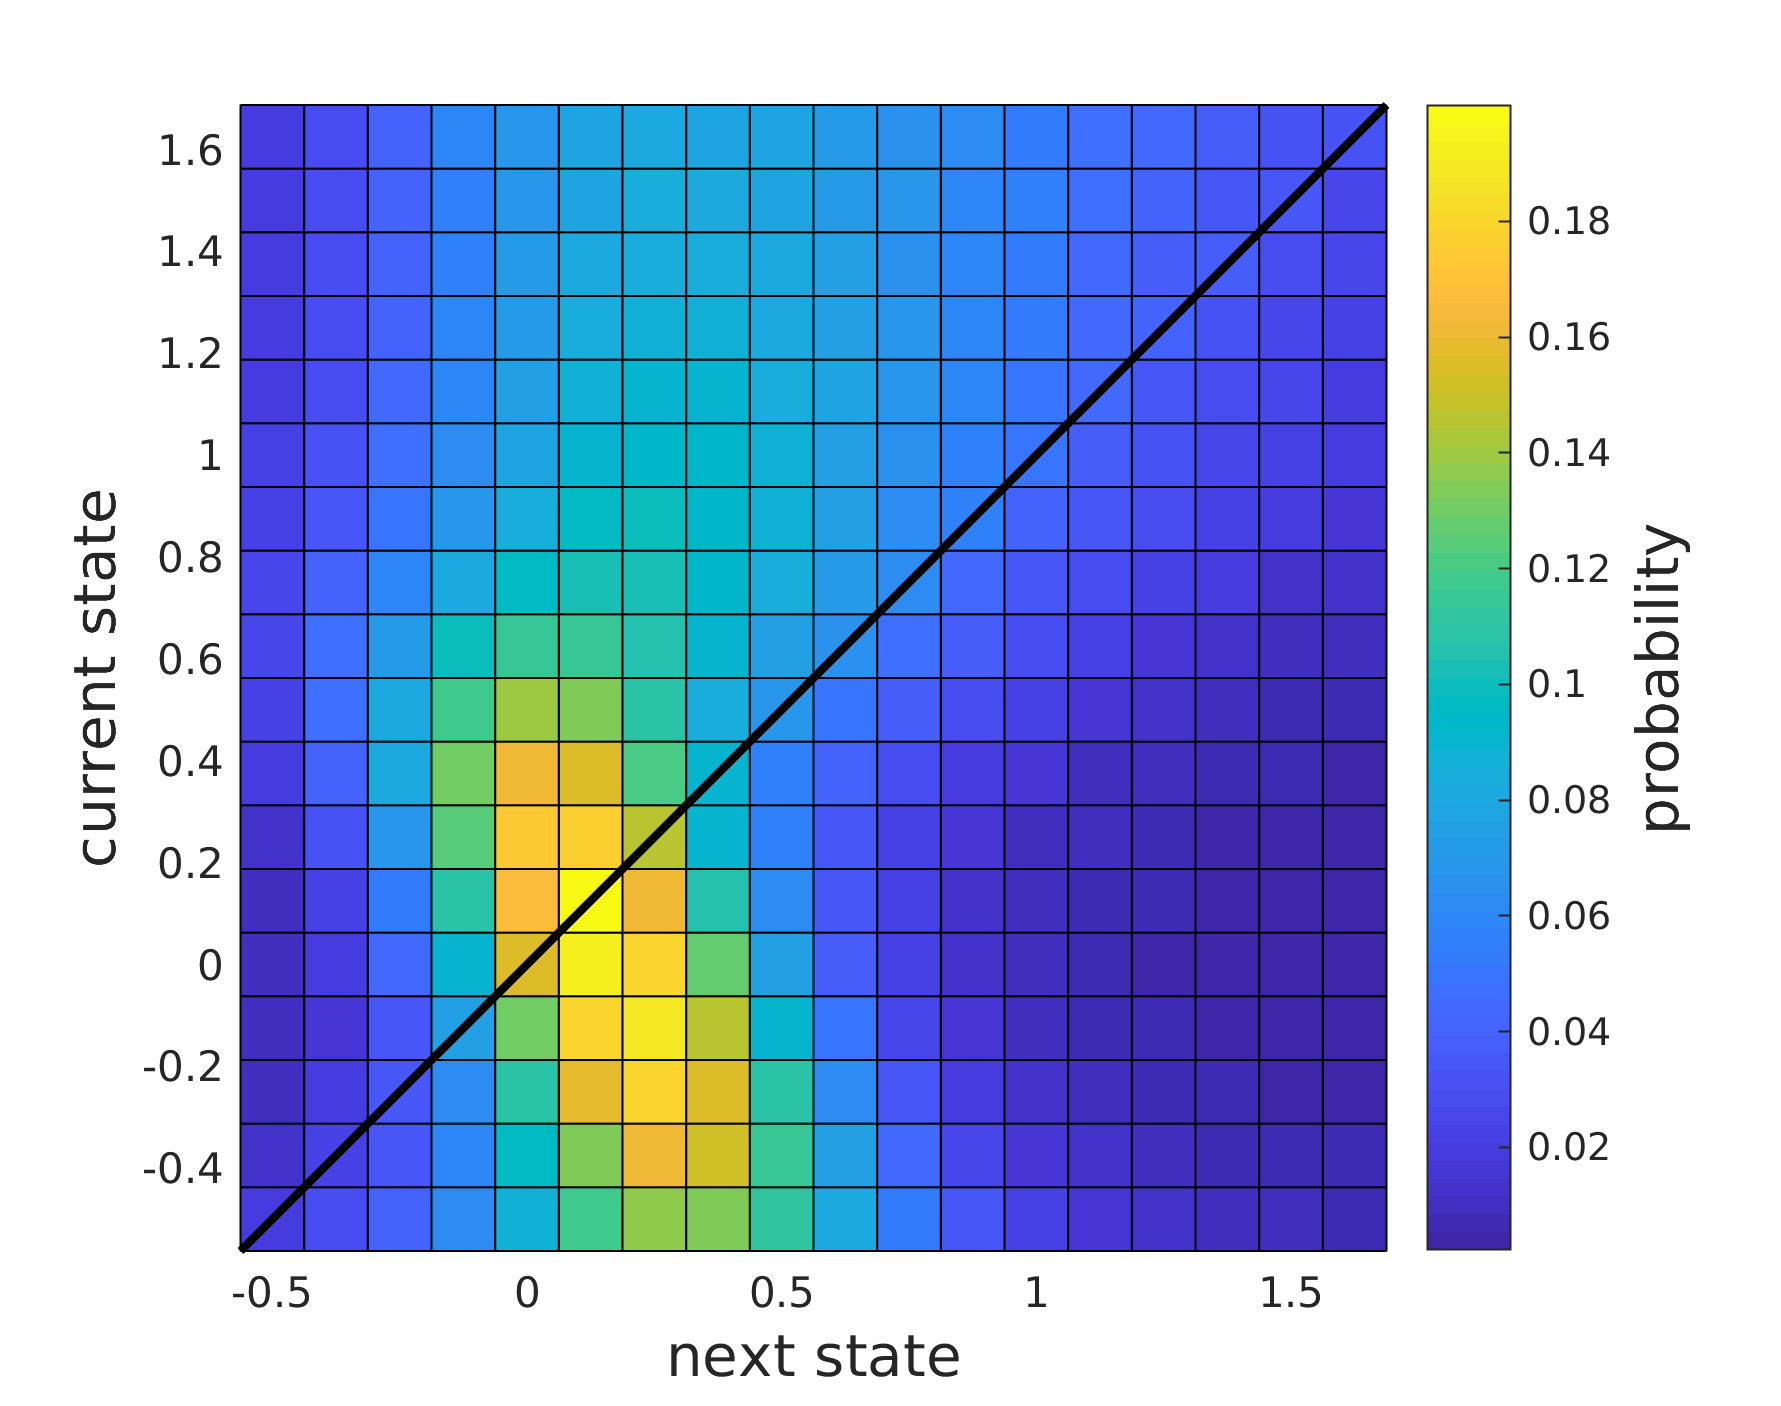
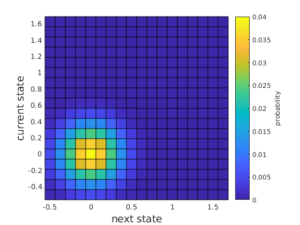
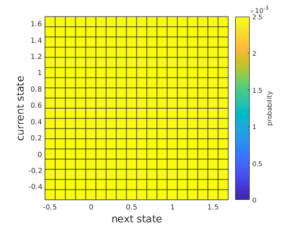
The main data-trained transition matrix shows that states will tend towards slightly aggradational. This makes sense since this system is deterministically net aggradation due to a RSLR forcing. We compare this data-trained model with two synthetic transition matrices: a Gaussian distribution (intentionally similar to the data) and a uniform distribution (i.e., purely random).
We then simulated the elevation change sequences predicted by each of the transition matrices and used the stratigraphic filter concept to determine the resultant stratigraphy. We did this a bunch of times, and totally chose one of the more “convincing” results (i.e., where the slope difference between simulations was larger).
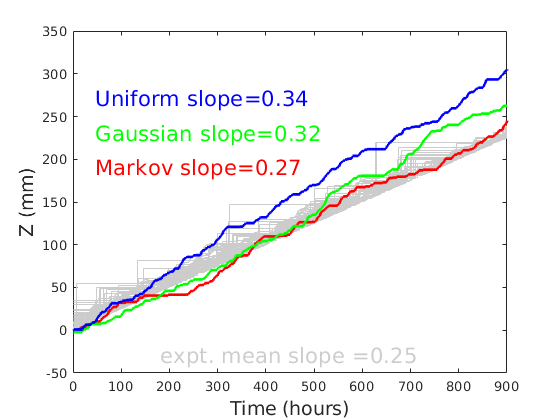
We found that the data-trained model reproduced the stratigraphic sequences from the experiment (based only on comparing slopes…). The other models were not too far off, suggesting that deltaic sedimentation is in fact not too far off from purely random.
Ultimately, we would simulate the models hundreds of times and make ensembles of the results to interpret. We also would use more meaningful statistics of the stratigraphic sequences to compare model and data, such as number of “channel cuts”, unconformity-bed thicknesses, “drowned” sequences, etc.
The main source code for all this lives on github here (https://github.com/amoodie/markov_delta) if you are interested in checking anything out or exploring some more. You will need to obtain the data from the SEN website listed above, or ask me to send you a copy of the data formatted into a .mat file (it’s too big to put on here…).
If you format the data yourself, produce a 3D matrix with each cell where the x-y-z coordinates are time-across-along.
Authors of the code and project are Kelly Sanks (@kmsanks) and Andrew J. Moodie (@amoodie).