History of the Houston Rodeo performances
The Houston Livestock Show and Rodeo is one of Houston’s largest and most famous annual events. Now, I won’t claim to know much about the Houston Rodeo, heck, I’ve only been to the Rodeo once, and have lived in Houston for a little over a year and a half! I went to look for the lineup for 2016 to see what show(s) I may want to see, but they haven’t released the lineup yet (comes out Jan 11 2016). I got curious of what the history of the event was like, and conveniently, they have a past performers page; this is the base source for the data used in this post.
First, I pulled apart the data on the page and built a dataset of each performer and every year they performed. The code I used to do this is an absolute mess so I’m not even going to share it, but I will post the dataset here (.rds file). Basically, I had to convert all the non-formatted year data, to clean uniformly formatted lists of years for each artist.
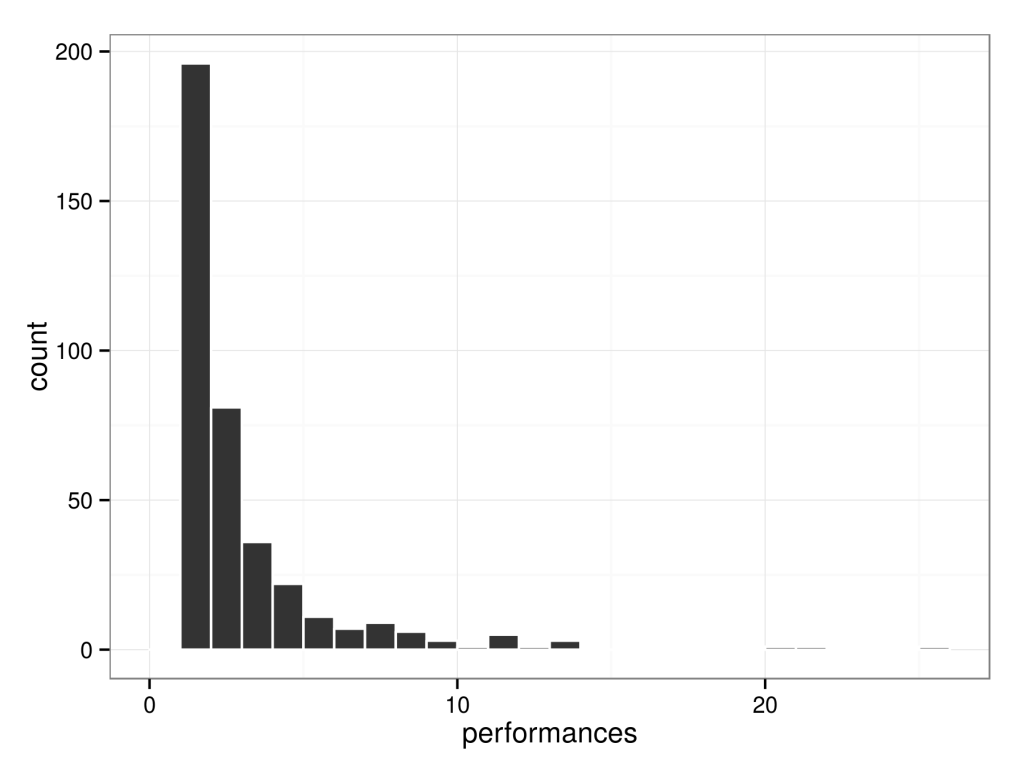
Above is the histogram of the number of performances across all the performers. As expected, the distribution is skewed right, towards the higher number of performances per performer. Just over 51% of performers have only performed one time, and 75% of performers have performed fewer than 3 times. This actually surprised me, I expected to see even fewer repeat performers. There have been a lot of big names come to the Rodeo over the years. The record for the most performances (25) is held by Wynonna Judd (Wynonna).
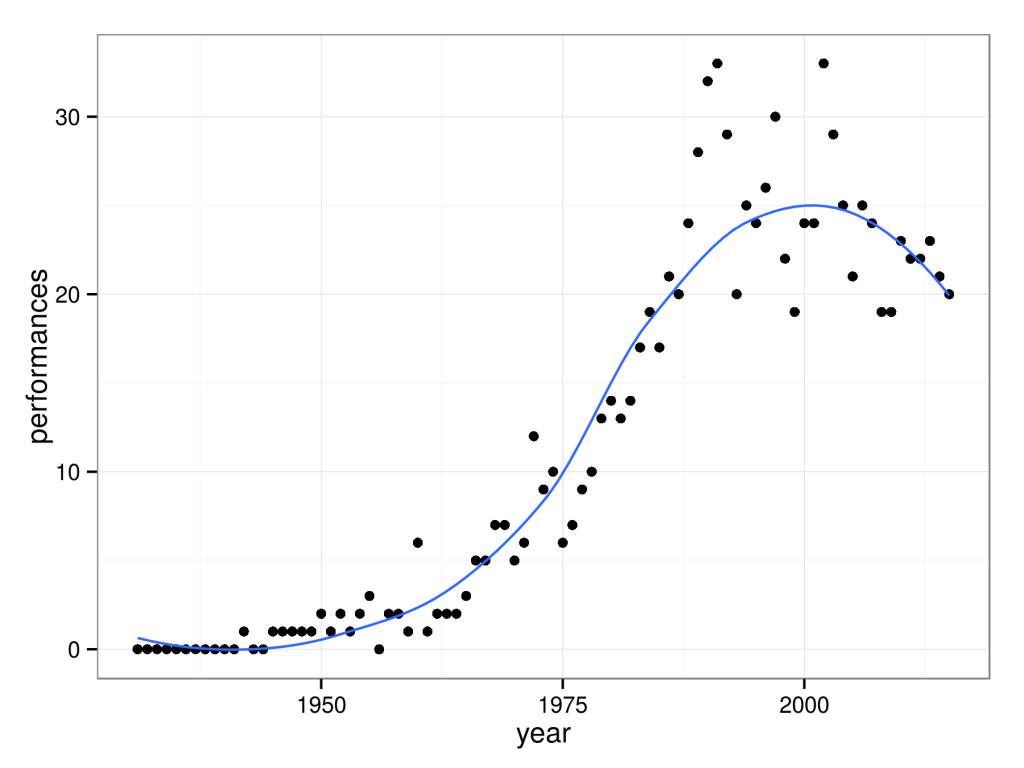
I then wanted to see how the number of shows per year changed over time, since the start of the Rodeo.
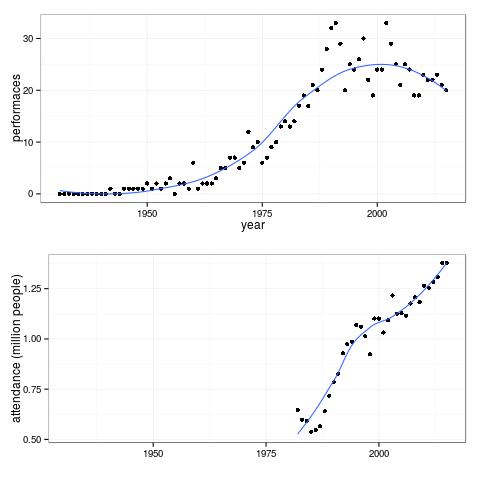
The above plot shows every year since the beginning of the Rodeo (1931) to the most recent completed event (2015). The blue line is a Loess smoothing of the data. Now, I think that the number of performances corresponds with the number days of the Rodeo (i.e. one concert a night), but I don’t have any data to confirm this. It looks like the number of concerts in recent years has declined, but I’m not sure if the event has also been shortened (e.g. from 30 to 20 days). Let’s compare that with the attendance figures from the Rodeo.
Despite fewer performances per year since the mid 1990s, the attendance has continued to climb. Perhaps the planners realized they could lower the number of performers (i.e. cost) and still have people come to the Rodeo. The Rodeo is a charity that raises money for scholarships and such, so more excess revenue means more scholarships! Even without knowing why the planners decided to reduce the number of performers per year, it looks like the decision was a good one.
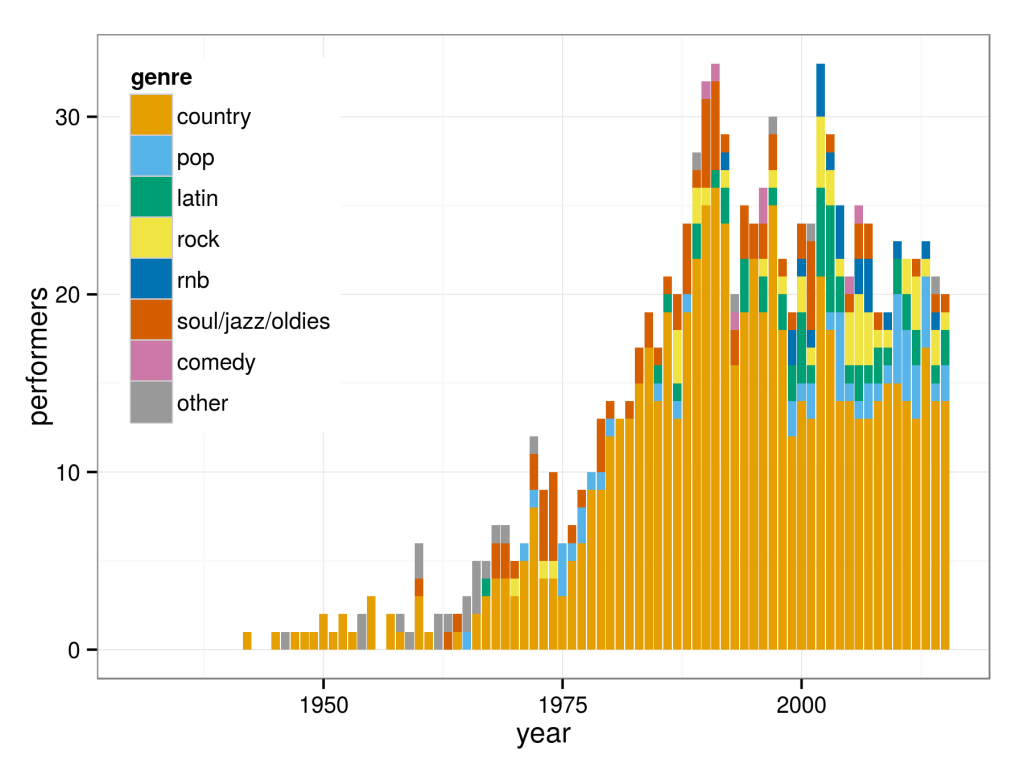
If we look back at the 2016 concerts announcement page, you can see that they list the genre of the shows each night, but not yet the performers. I wanted to see how the division of genre of performers has changed over the years of the Rodeo. So, I used my dataset and the Last.fm API to get the top two user submitted “tags” for each artist. I then classed the performers into 8 different genres based on these tags. Most of the tags are genres so about 70% of the data was easy to class, I then manually binned all the remaining artists into the genres, trying to be as unbiased as possible.
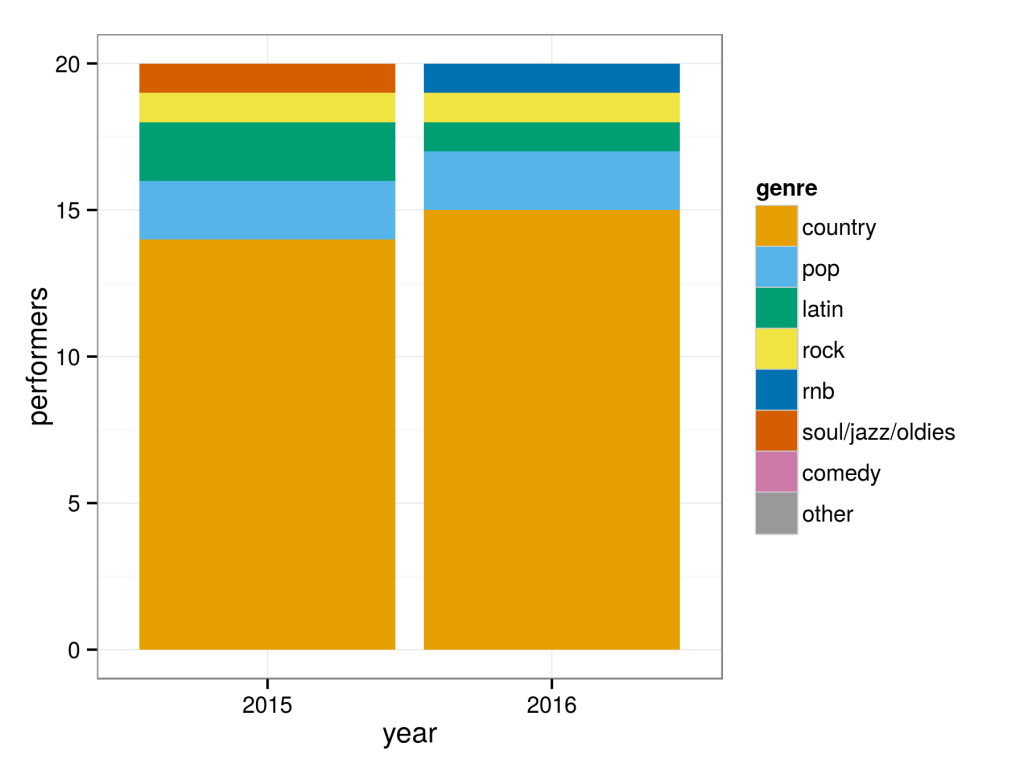
It’s immediately clear that since the beginning, country music has always dominated the Houston Rodeo lineup. I think it’s interesting to see the increase in variety of music since the late 1990s, beginning to include a lot more Latin music and pop. I should caveat though, that the appearance of pop music may be complicated by the fact that what was once considered “pop” is now considered “oldies”. There have been a few comedians throughout the Rodeo’s run, but none in recent years. 2016 will feature 20 performances again, with a split that looks pretty darn similar to 2015, with a few substitutions:

